Introduction
Many of us may be aware that carbohydrate-containing foods influence blood sugar levels. Still, we may not know how different carbohydrate-containing foods are qualified and quantified based on their influence on blood sugar levels.
The Glycaemic Index (GI) and Glycaemic load (GL) are the methods of calculating how foods containing carbohydrates may influence your blood sugar level.
The Glycaemic Index (GI) rates the foods containing carbohydrates based on how fast or slow they increase the blood glucose level. The Glycaemic Load (GL) rates a carbohydrate-containing food considering its Glycaemic Index (GI) and actual carbohydrate content.
Knowing the meaning of the Glycaemic Index (GI) and Glycaemic Load (GL) and how they are calculated may help you to understand and appreciate the discussion with your family doctor or dietician when he/she prescribes a particular diet based on the medical reports.
The original purpose of developing GI and GL was to establish which foods work well for people with diabetes. Still, they can be useful for managing blood sugar and diet planning for non-diabetic people.
This article explains the Glycaemic Index and how it is calculated. Read the article What is Glycaemic Load (GL) to know the GL and how it is computed.
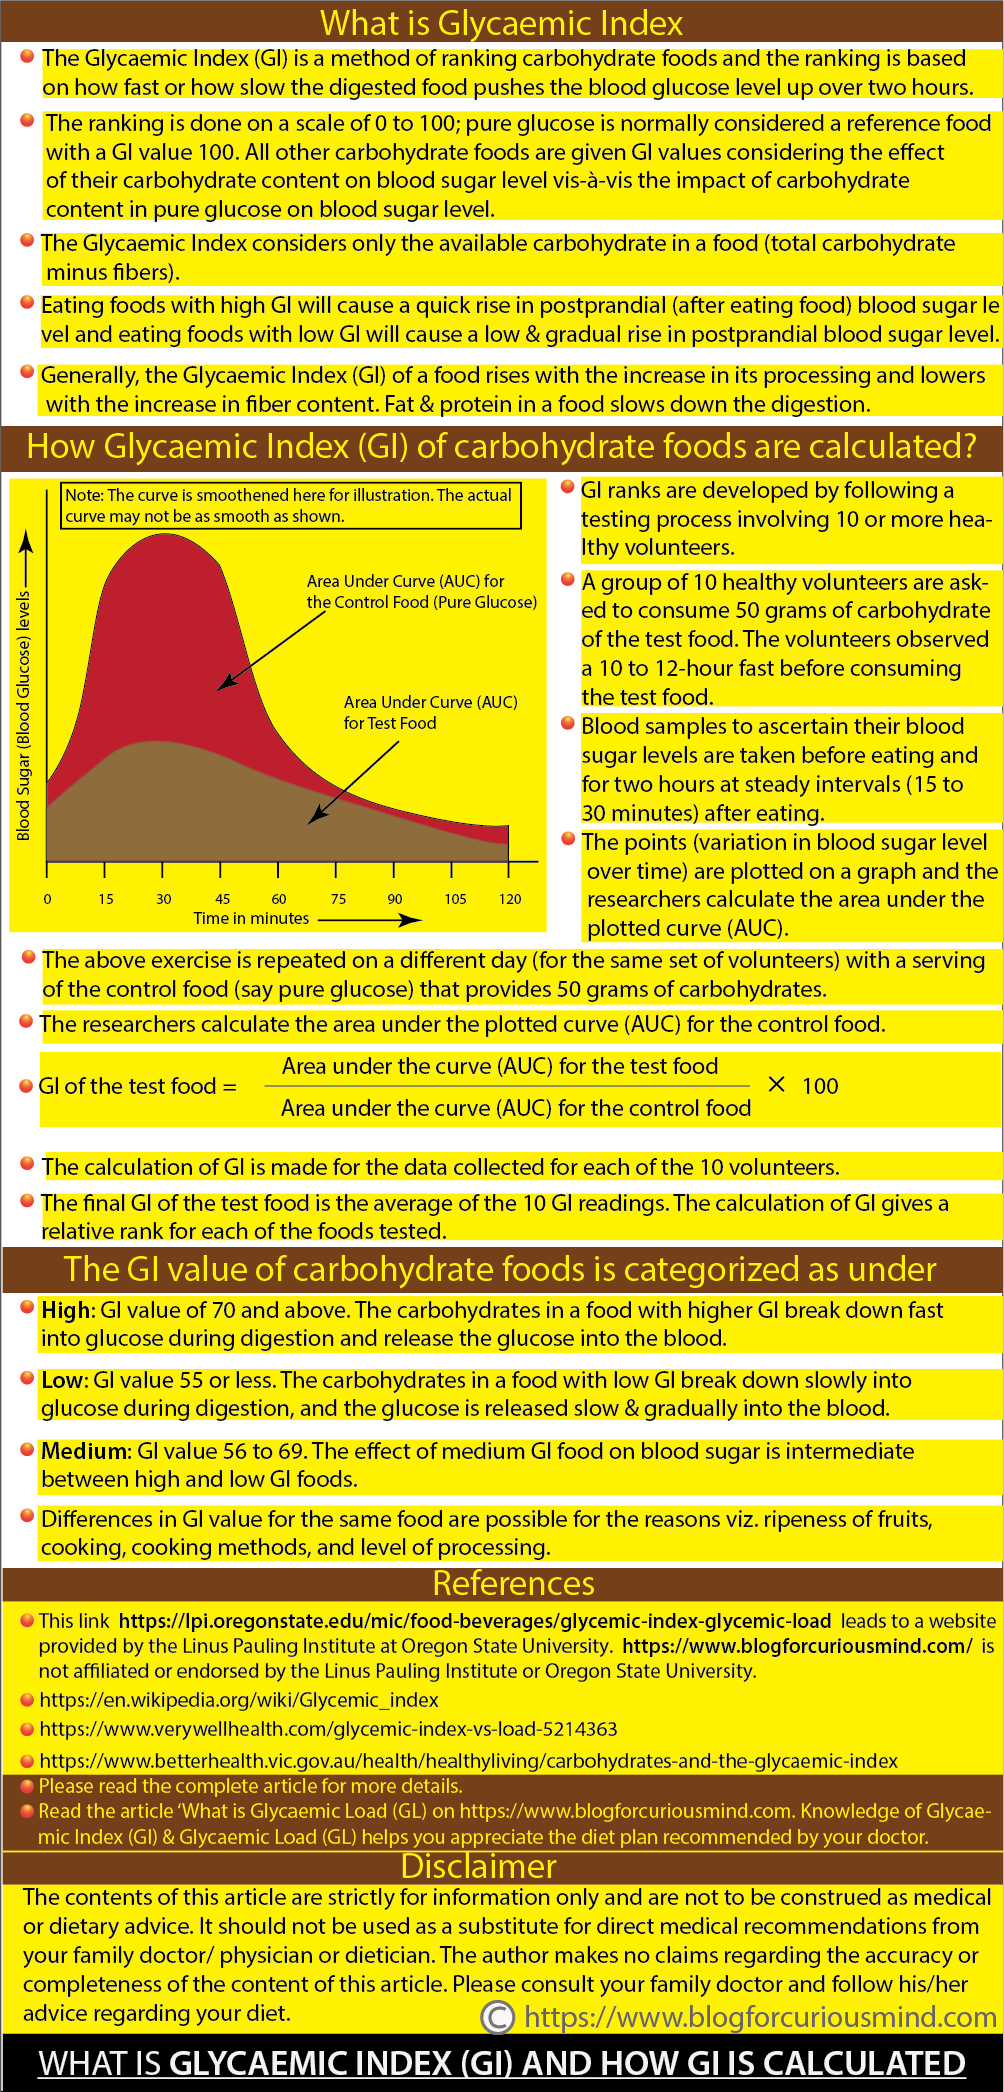
What is Glycaemic Index (GI)
The Glycaemic Index (GI) is a method of grading foods containing carbohydrates and the grading is based on how fast or how slow the digested food pushes the blood glucose level up over two hours. It is a relative grading of how various carbohydrate foods influence blood sugar levels. The grading is done on a scale of 0 to 100.
The measurement of the Glycaemic Index (GI) normally considers pure glucose as a reference food and accords a GI mark of 100 to it. All other carbohydrate-containing foods are given GI scores considering the effect of their carbohydrate content on blood sugar level vis-à-vis the effect of carbohydrate content in pure glucose on blood sugar level. The Glycaemic Index considers only the available carbohydrate in a food (total carbohydrate minus fibers). Please see the next section ‘How Glycaemic Index (GI) of carbohydrate foods are calculated’ for more on this.
Eating foods with high GI will cause a quick increase in postprandial (after eating food) blood sugar level; on the other hand, eating foods with low GI will cause a low and gradual increase in postprandial blood sugar level.
The theory of the Glycaemic Index (GI) was presented in 1981 by Canadian scientist David J. Jenkins, MD, of the University of Toronto. Before the theory of the glycaemic Index (GI),’ carbohydrate-containing foods were divided into two categories ‘simple’ and ‘complex.’
The theory of the Glycaemic Index (GI) has been developed as a better method to rank foods containing carbohydrates based on their overall influence on postprandial blood sugar levels.
Generally, the Glycaemic Index (GI) of a food rises with the increase in its processing and lowers with the increase in fiber content. This means highly processed foods have a higher Glycaemic Index (GI) and food containing fiber has a lower GI. The fat and protein content in food affects its Glycaemic Index; proteins slow down digestion.
The Glycaemic Index of carbohydrate foods is categorized as under:
High
GI value of 70 and above. The carbohydrates in a food with higher GI break down fast into glucose during digestion and release the glucose into the blood. Examples of higher GI foods are bakery foods, cakes, cookies, white rice, baked potatoes, cornflakes, white bread, instant noodles, etc.
Low
GI value 55 or less. The carbohydrates in a food with low GI break down slowly into glucose during digestion, and the glucose is released slowly and gradually into the blood. Low-GI carbohydrate foods have fibers that slow down digestion; examples of low-GI carbohydrate foods are non-refined grains, oats, legumes, lentils, beans, pasta, some vegetables, fruits, etc. When you consume food with a low GI rating, it will stay in your digestive system for a longer period (compared to consuming a food with high GI rating) and keep you active for more time by releasing the necessary energy.
Medium
GI value 56 to 69. The time taken for breaking down medium GI foods into glucose and its release into blood lies between the above two. Examples of medium GI foods are whole grains bread, honey, orange juice, etc.
Glycaemic Index (GI) charts normally give one GI value for each food. However, differences in GI value for the same food are possible for the following reasons:
- Ripeness of fruits: riper fruits contain higher sugars and a higher GI. The GI of a ripe banana is higher than a raw banana.
- Cooking and cooking methods: Cooking can change the GI since cooked food can be digested fast and tend to have a higher GI.
- Processing: Processing of foods makes digestion easy, resulting in a higher GI score. Both brown rice and white rice are obtained from paddy, but white rice has a higher GI compared to brown rice since white rice has undergone more processing.
It is also true that when you consume a mix of high GI and low GI foods, the overall GI of the food consumed by you can be an intermediate value of the GIs of all food consumed (giving due consideration to the size of servings of each food).
Foods that largely contain protein and/or fats are not given a Glycaemic Index (GI) number since such foods have minor effects on blood sugar levels.
How Glycaemic Index (GI) of carbohydrate foods are calculated
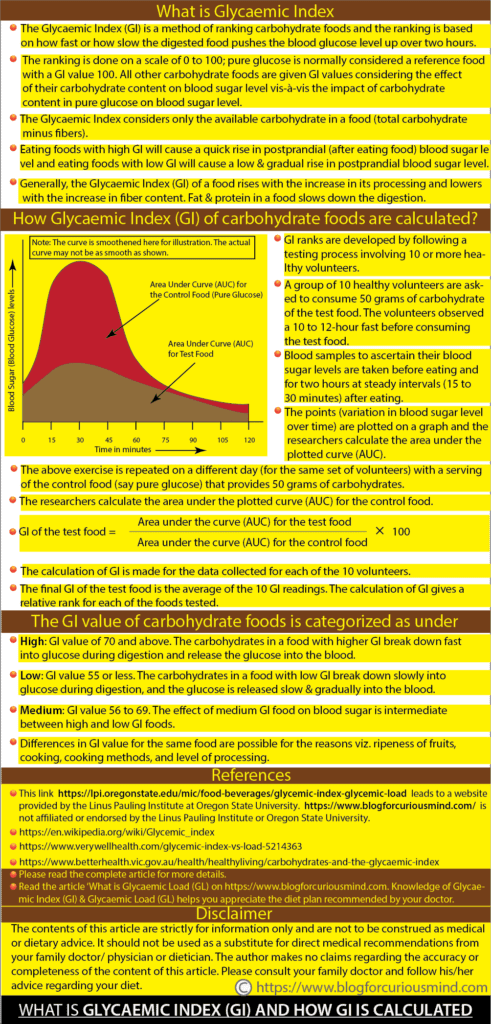
Glycaemic Index (GI) scores are developed by following a thorough testing process involving 10 or more healthy volunteers.
- A group of 10 healthy volunteers are asked to consume 50 grams of carbohydrate of the test food whose GI is to be calculated. The volunteers observed a 10 to 12-hour fast before consuming the test food.
- Blood samples of the volunteers to ascertain their blood sugar levels are taken before eating and for two hours at steady intervals (15 to 30 minutes) after eating.
- The points (variation in blood sugar level over time) are plotted on a graph and the researchers calculate the area under the plotted curve (AUC).
- The above exercise is repeated on a different day (for the same set of volunteers) with a serving of the control food (say pure glucose) that provides 50 grams of carbohydrates.
- Again, the points (variation in blood sugar level over time for the control food) are plotted on a graph and the researchers calculate the area under the plotted curve (AUC).
- Glycaemic Index (GI) of the test food = (Area under the curve (AUC) for the test food ÷ area under the curve (AUC) for the control food) × 100
- The calculation of GI is made for the data collected for each of the 10 volunteers.
- The final GI of the test food is the average of the 10 GI readings. The calculation of GI gives a relative score for each of the foods tested.
Experts feel the major flaws of the Glycaemic Index (GI) are that it does not account for the quantity of food (carbohydrate) eaten, other nutrients in the food viz. fat, protein, minerals, and antioxidants, and other constituents in the meal that have an influence on the blood sugar level. Obviously, your plate has a mix of carbohydrate foods, fruits, vegetables, fruit juices, etc. So, your blood sugar is influenced by the net effect of all the food consumed by you.
The Glycaemic Index (GI) considers only the carbohydrates in the food. Protein and fat contained in food can delay the digestion of carbohydrates and hence slow down the rise in blood sugar levels. The Glycaemic Index does not consider the insulin response to the consumption of test food.
Please refer to the following website for more information on GI and GL.
This link leads to a website provided by the Linus Pauling Institute at Oregon State University. https://blogforcuriousmind.com/ is not affiliated or endorsed by the Linus Pauling Institute or Oregon State University.
Also, please go through the websites mentioned under reference (at the end of this article).
You may watch this, this, and this YouTube videos
Conclusion
Studies indicate that consumption of high GI or high GL foods may be related to the risk of unfavorable health conditions including Type 2 Diabetes. Lowering the consumption of high GI or high GL foods may help people with Type 2 Diabetes to control their blood sugar limits within control. Please consult your family doctor or physician and seek his/her help to fix an appropriate diet for you.
You may read the following articles
Caution
The contents of this article are strictly for information only and are not to be construed as medical or dietary advice. The content of this article should not be used as a substitute for direct medical recommendations from your family doctor physician or dietician. Please consult your family doctor and physician and follow his/her advice regarding the diet and food good for you.
References
https://en.wikipedia.org/wiki/Glycemic_index
https://www.verywellhealth.com/glycemic-index-chart-for-common-foods-1087476
https://www.verywellhealth.com/glycemic-index-vs-load-5214363
https://www.betterhealth.vic.gov.au/health/healthyliving/carbohydrates-and-the-glycaemic-index